Blog Details

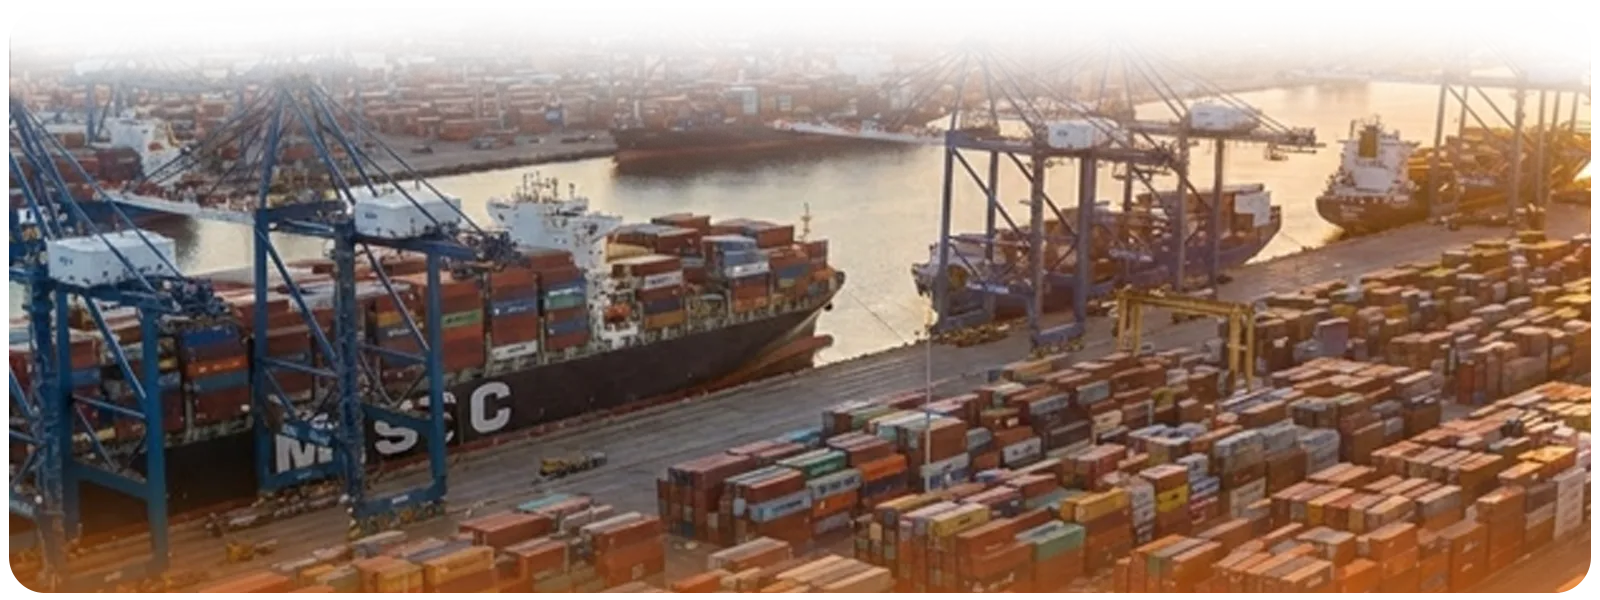
Port of LA Hits 8.7M TEU, Eyes 10M Annual Record
Importers racing to beat anticipated tariffs drive volumes near historic milestones despite a seasonal dip in loaded imports.
SAN PEDRO, Calif., November 19, The Port of Los Angeles in October 2025, bringing its year-to-date total of 848,431 Twenty-Foot Equivalent Units (TEUs) in October, bringing its year-to-date total to 8,655,489 TEUs.
This performance positions the Western Hemisphere’s busiest container port to potentially surpass the 10 million TEU milestone for the calendar year, a feat achieved only twice previously in its history.
While total monthly volume declined 6.25% compared to an exceptionally strong October 2024, the port remains 2% ahead of its 2024 pace year-to-date.
Why Importers Are Moving Early
During a media briefing on Tuesday, Executive Director Gene Seroka confirmed that the sustained high volumes are largely the result of a "tariff frontloading" strategy adopted by U.S. importers.
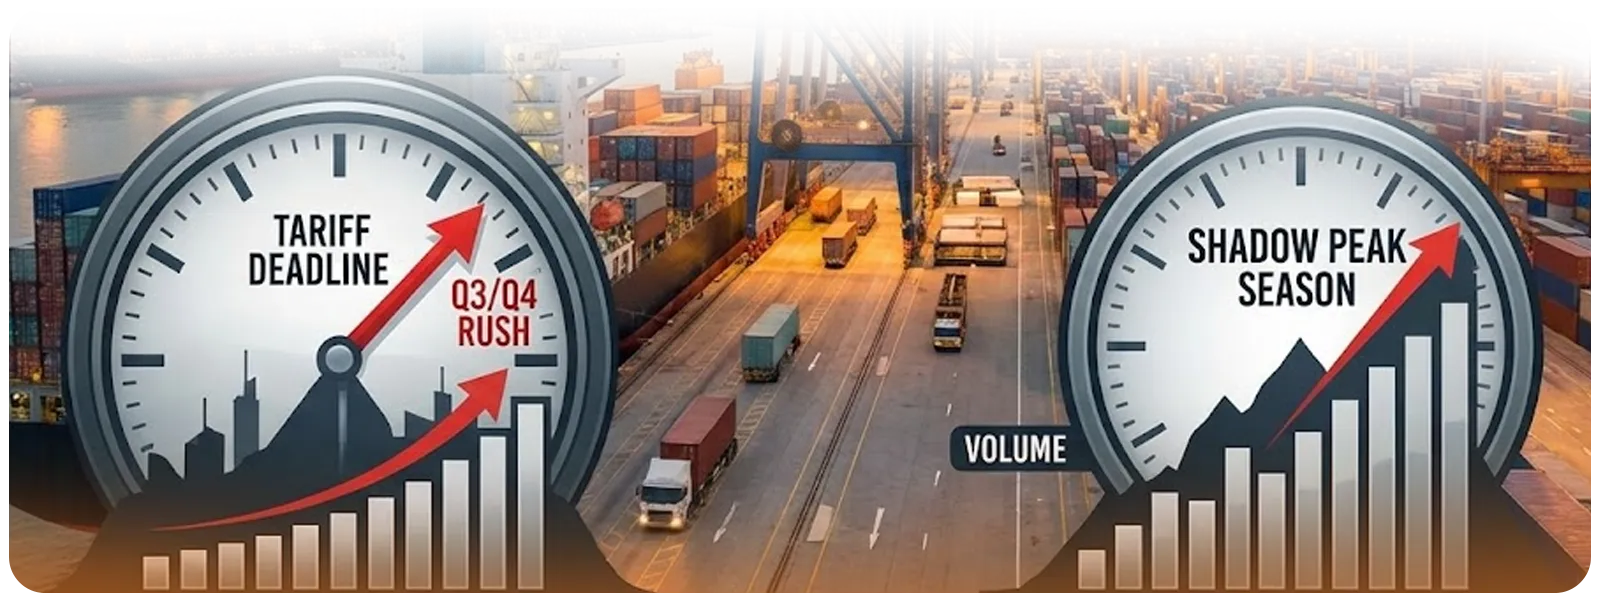
Retailers and manufacturers have accelerated cargo shipments throughout the third and fourth quarters to preempt potential duty increases associated with the incoming U.S. administration and changes in trade policy.
Seroka noted that this urgency created a "shadow peak" season, keeping terminals active well past the traditional holiday shipping window, although he acknowledged that "retail and manufacturing inventories were already well stocked."
A Peak Season Without a Playbook
Los Angeles’ surge occurs amid significant trade volatility. Importers are currently balancing high inventory levels with the risk of future protectionist measures.
This defensive posturing has distorted typical seasonal patterns, maintaining high throughput even as consumer demand signals show signs of normalizing.
The "tariff rush" has effectively pulled cargo forward from early 2026, insulating the port from the immediate effects of the broader market softening seen in freight rates.
Key October Metrics
October 2025 operational statistics released by the port include:
- Total Volume: 848,431 TEUs (down 6.25% YoY).
- Loaded Imports: 429,280 TEUs (down 7.23% YoY).
- Loaded Exports: 123,764 TEUs (up 0.86% YoY).
- Empty Containers: 295,380 TEUs (down 7.57% YoY).
- Operational Efficiency: 40 vessel gangs working with zero labor cuts; rail dwell times averaged 3.6 days.
How the Tariff Rush Is Reshaping Supply Chains

The aggressive frontloading of inventory is already impacting market dynamics. With warehouses full and holiday merchandise landed, demand for immediate transpacific slot capacity is evaporating.
This softening demand is reflected in spot rates; the Drewry World Container Index reported a 12% drop in spot rates from Shanghai to Los Angeles for the week of November 13.
Additionally, the slight rise in exports indicates a localized recovery in outbound commodities, but the decline in empty container repositioning suggests carriers anticipate weaker import demand from Asia in the near term.
A Tariff-Driven Bubble?

The Port of Los Angeles is effectively "borrowing" volume from the first quarter of 2026. By accelerating shipments to mitigate tariff risks, importers have created a temporary demand bubble that is likely to be followed by a volume vacuum.
Once this protective inventory is digested, the industry should anticipate a sharp correction in import volumes and further pressure on freight rates in early 2026. The current activity is driven by policy mitigation rather than organic consumption growth.
Environmental Metrics Show Continued Improvement
In parallel with its operational report, the port released its 2024 Inventory of Air Emissions. The data reveals that despite rising cargo volumes, the port has successfully decoupled economic growth from environmental impact.
Since 2005, diesel particulate matter (DPM) emissions have fallen by 90%, sulfur oxides (SOx) by 98%, and nitrogen oxides (NOx) by 73%, strengthening the port’s appeal to ESG-conscious shippers monitoring Scope 3 emissions.
Volume Outlook for Late 2025 and Early 2026
Port leadership forecasts a seasonal slowdown in the range of 10% to 15% for the remainder of the year as the tariff rush subsides and the industry enters the traditional slack season.
The port is monitoring potential regulatory shifts in 2026 that could impact trucking capacity and further alter cargo flow patterns.